Latency Engineering / Runtime Isolation
NullRing
The project asks a narrow question and answers it honestly: once the handoff path is reduced to the essentials, the remaining latency belongs as much to the machine as it does to the code.
Observed Floor
92ns
best observed end-to-end sample, cache-warm
Median Latency
142ns
producer -> ring -> evaluator path
Evaluator Throughput
52.7M/s
tight-loop evaluator benchmark, not full pipeline
Master Schematic
System Control & Data Flow Under Windows User-Space
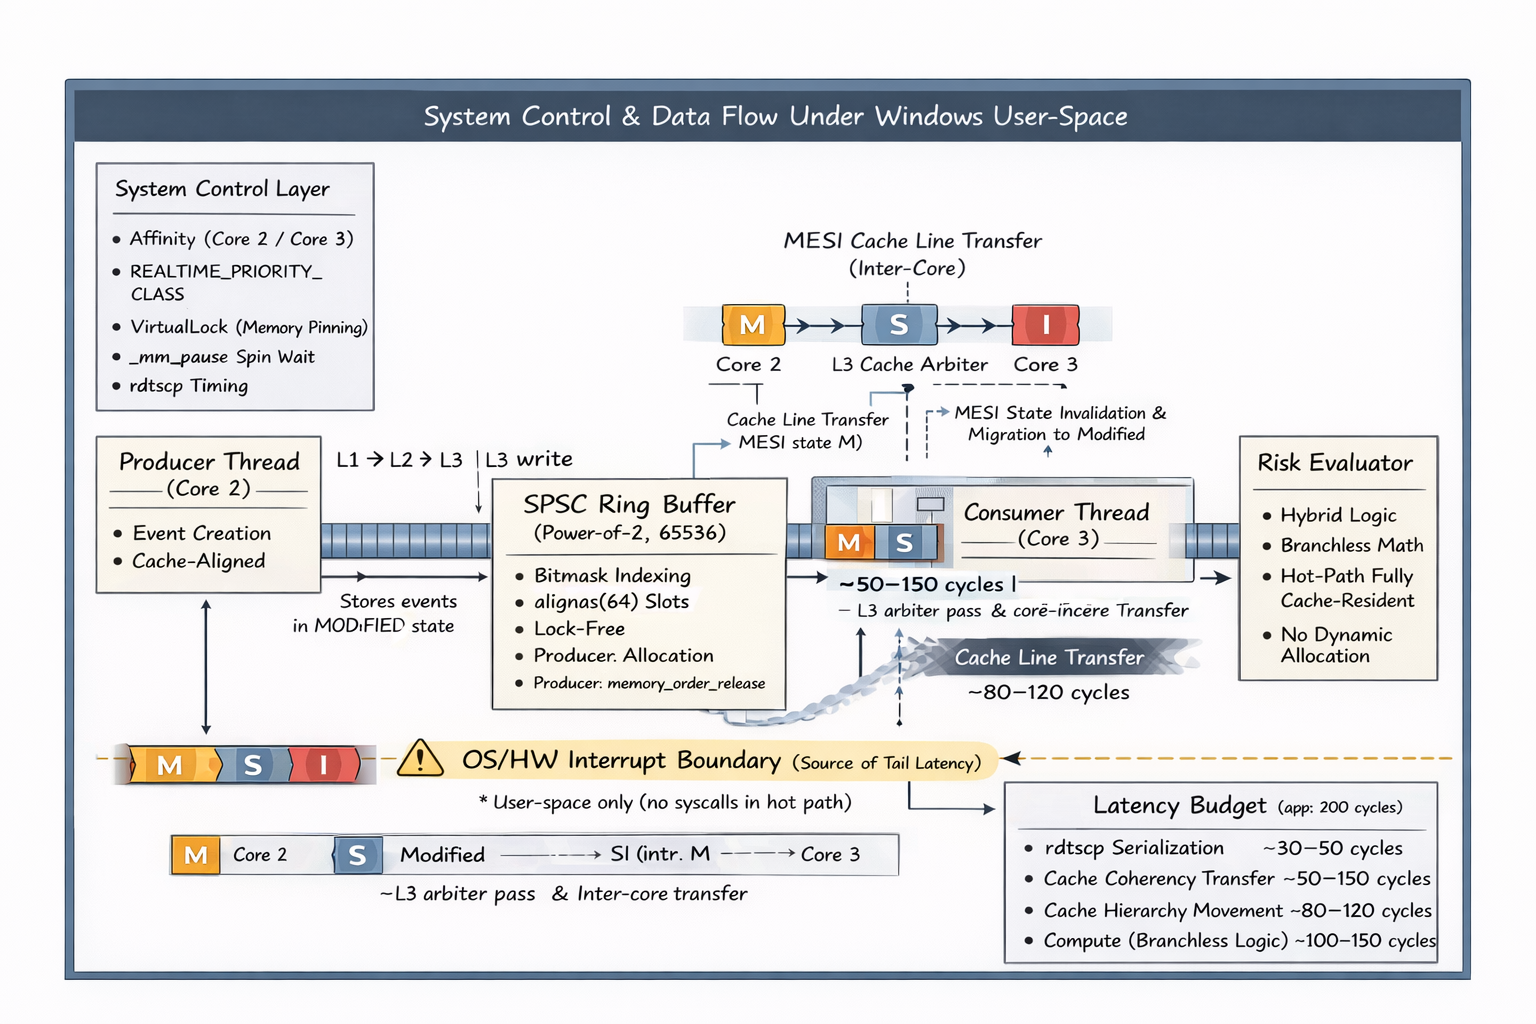
Complete architectural flow showing L1-L3 cache interactions, thread affinity, and the branchless evaluator execution path.
The Premise
Isolating the lower bound of user-space risk evaluation.
NullRing exists to answer a very narrow question: once locks, dynamic allocation, and unnecessary sharing are stripped out of the hot path, how much latency belongs to the machine, and how much belongs to the code?
Low-latency infrastructure is widely discussed in vague terms, but modern systems work increasingly depends on understanding exactly where software ends and hardware behavior begins. Without a design like this, latency budgets disappear into allocator work and scheduler wake-ups long before business logic becomes the real constraint.
The durability of NullRing comes from this underlying need. Engineers will continue to care about cache behavior and honest tail latency long after specific APIs or frameworks change.
Animation showing the physical delay of transferring a cache line from Core 2's L1 cache through the L3 arbiter into Core 3's L1 cache. This physical movement is the true floor of the latency budget.
A Deliberately Narrow Handoff
The architecture is intentionally small.
One producer core publishes into a power-of-two SPSC ring, and one consumer core evaluates the event. Narrowness is a design choice, not a missing feature.
This removes avoidable hot-path costs by fixing the payload shape, using acquire/release atomics, and keeping the ownership transfer model strictly contained. Shared mutable state is entirely avoided, making the synchronization contract small and the ownership boundaries explicit.
The defensibility comes from engineering judgment: knowing which abstractions to remove, how to measure honestly, and which caveats to keep visible even when they weaken the headline.
- single-producer single-consumer ring
- acquire on consume, release on publish
- cache-line-separated head and tail indices
Memory Layout Details
The budget is smaller than a routine abstraction cost.
At this latency scale, a heap allocation, stray branch, or false-sharing mistake can cost more than the entire target budget. The implementation detail *is* the story.
The strongest differentiator isn't just the ring buffer. It is the combination of fixed-point evaluation, cache-line separation, explicit thread affinity, and benchmark transparency.
By enforcing strict 64-byte padding alignments on the ring indices, we guarantee that the producer and consumer cores never contest the same cache line during concurrent operations, eliminating the false sharing penalties that typically plague multi-threaded queues.
Implementation Scope
The Full Pipeline

The complete implementation boundary, showing exactly where user-space software interacts with hardware buffers.
Optimization Journey
~800ns
std::chrono, no affinity
Naive Baseline
A simple producer-consumer pipeline. Median latency was ~500-800ns with enormous variance. std::chrono resolution is too coarse, hiding the true shape of the latency curve.
auto start = std::chrono::high_resolution_clock::now();
// ... execute ...
auto end = std::chrono::high_resolution_clock::now();
Source
RDTSC Integration
Replaced std::chrono with __rdtsc() for cycle-accurate measurement. The measurements became precise enough to reveal a bimodal distribution: events hitting L1 vs events triggering inter-core cache transfers.
inline uint64_t rdtsc() {
    unsigned int lo, hi;
    __asm__ __volatile__ ("rdtsc" : "=a" (lo), "=d" (hi));
    return ((uint64_t)hi << 32) | lo;
} SourceRDTSCP Serialization
__rdtsc can be speculatively executed, artificially lowering latency readings. __rdtscp acts as a serialization barrier, adding ~30–50 cycles of overhead but ensuring the measurement is honest.
inline uint64_t rdtscp() {
    unsigned int lo, hi, aux;
    __asm__ __volatile__ ("rdtscp" : "=a" (lo), "=d" (hi), "=c" (aux));
    return ((uint64_t)hi << 32) | lo;
} SourceCore Affinity
By binding the producer and consumer to specific logical cores via sched_setaffinity, we eliminated OS thread migration. This caused the biggest absolute drop in median latency.
cpu_set_t cpuset;
CPU_ZERO(&cpuset);
CPU_SET(core_id, &cpuset);
pthread_setaffinity_np(pthread_self(), sizeof(cpu_set_t), &cpuset);
Source
Padding & False Sharing
The head and tail pointers of the ring buffer were occupying the same cache line. Every time the producer wrote, it invalidated the consumer's cache. Aligning to 64-byte boundaries fixed the ping-ponging.
struct alignas(64) PaddedEvent {
    Event data;
    // ... padding implicitly added by compiler
}; SourceRelaxed Atomics
Replaced sequential consistency (seq_cst) with acquire/release semantics. The CPU is now allowed to reorder non-dependent instructions around the atomic operations.
tail_.store(next_tail, std::memory_order_release);
// ... consumer side ...
auto current_tail = tail_.load(std::memory_order_acquire);
Source
Branchless Evaluation
Eliminated early-exits in the evaluator. The CPU evaluates all branches using bitwise ops and CMOV (conditional move) to avoid expensive branch misprediction penalties entirely.
// Branchless assignment
uint64_t mask = -(val > threshold); // 0 or 0xFFF...
result = (a & mask) | (b & ~mask);
Source
Fixed-Point Math
Floats cause variable latency depending on the ALU state (e.g., denormal penalties). Migrating the evaluator engine to 64-bit integer fixed-point math provided the final, deterministic ceiling.
// Fixed-point scale: 1.0 = 1 << 16
int64_t scaled_val = (val * MULTIPLIER) >> 16;
Source
Proof of Execution
Interpreting the Absolute Truth
╔══════════════════════════════════════════════════════════╗
║ NullRing — Latency Benchmarking Suite                    ║
╠══════════════════════════════════════════════════════════╣
║ Events:    1000000 ║  Ring Size: 65536 ║  Warm-up: 10000 ║
╚══════════════════════════════════════════════════════════╝

── Benchmark 2: End-to-end (Producer → Ring → Evaluator) ──
  Average         478 cycles   150 ns
  Median (p50)    453 cycles   142 ns
  p95             517 cycles   162 ns
  p99             549 cycles   172 ns
  p99.9          7493 cycles  2346 ns ← OS scheduler domain
  Min             293 cycles    92 ns
What do these numbers mean?
A nanosecond is one billionth of a second. For context, light travels about one foot in a single nanosecond. This system processes a full risk event across cores in 142ns. A standard memory allocation (\`malloc\`) alone can easily take longer than this entire pipeline.
Out of 1,000 events, 999 are processed faster than 2,346ns. This rare "tail latency" is what kills performance in high-frequency environments, and measuring it honestly is the hardest part of systems benchmarking.
At these microscopic speeds, our code is no longer the bottleneck. The tail latency spikes are caused by the operating system pausing our thread to handle hardware interrupts. We have hit the physical limits of user-space software.
Next Case
AccretionDB